Proposition 218 Notices
PUBLIC HEARINGS NOTICE: Due to the COVID-19 pandemic, the Jan. 24 public hearings on IRWD's proposed rate changes and the redistricting of Board division boundaries will be conducted virtually via Webex as well as in person. Customers or property owners may attend and comment in either format. The Webex link will be posted on the Board Meetings calendar.
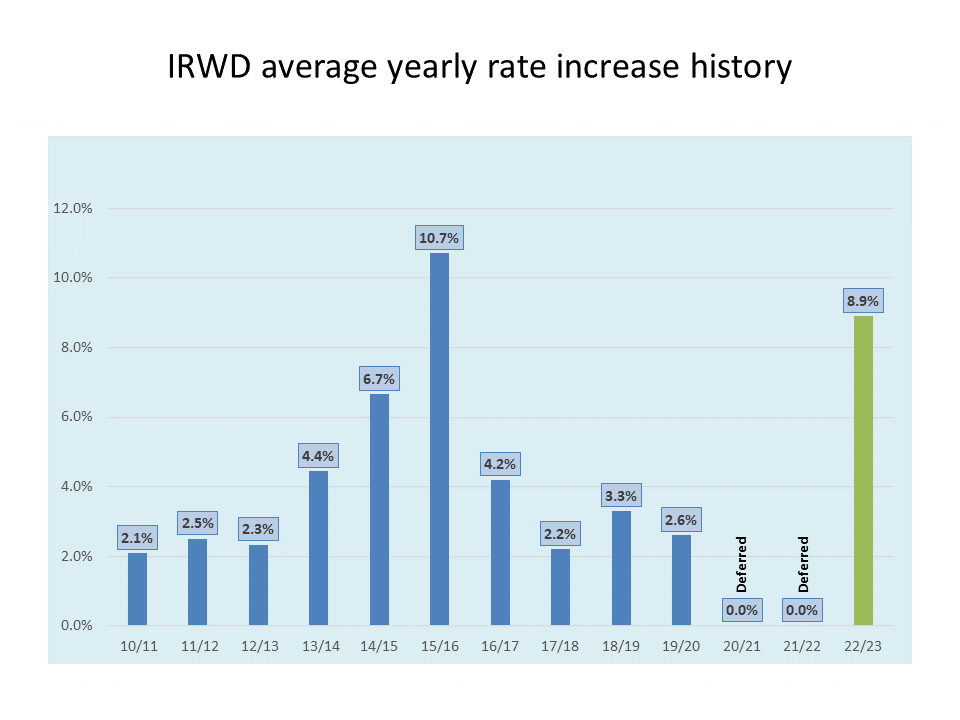
The Irvine Ranch Water District (IRWD) is a public agency that provides water and sewer service. Our rates are based on the actual cost to provide water and sewer service to our customers and are based on the expenses included in IRWD's budget. The proposed rates will be effective January 24, 2022, and implemented beginning February 1, 2022. As proposed, they are expected to increase the average residential bill by 8.9%. See below for how the rates are calculated.
A critical IRWD business objective is to keep costs, and therefore rates, as low as possible for our customers. Even with the proposed increase, when compared with other agencies providing similar services in Orange County, IRWD’s rates are consistently among the lowest.
To estimate your bill and learn how saving water helps keep your rates low, residential and landscape customers can use our Rate Calculator. Commercial, industrial, public authority and nonresidential customers, please contact Customer Service at 949-453-5300.
To read the IRWD Cost of Service Study, please click here.
Proposed Rate Changes for FY 2021-22 & FY 2022-23
For specific details on proposed rate changes that apply to you, please read the IRWD Proposition 218 Notice that was mailed to your home or business. The FY 2021-22 & FY 2022-23 Operating Budget and FY 2021-22 & FY 2022-23 Capital Budget are available by clicking the links.
Proposition 218 Notices for proposed rates beginning February 1, 2022
Please select from the following links to learn about the rate changes that apply to you.
Understanding the IRWD budget-based rate structure
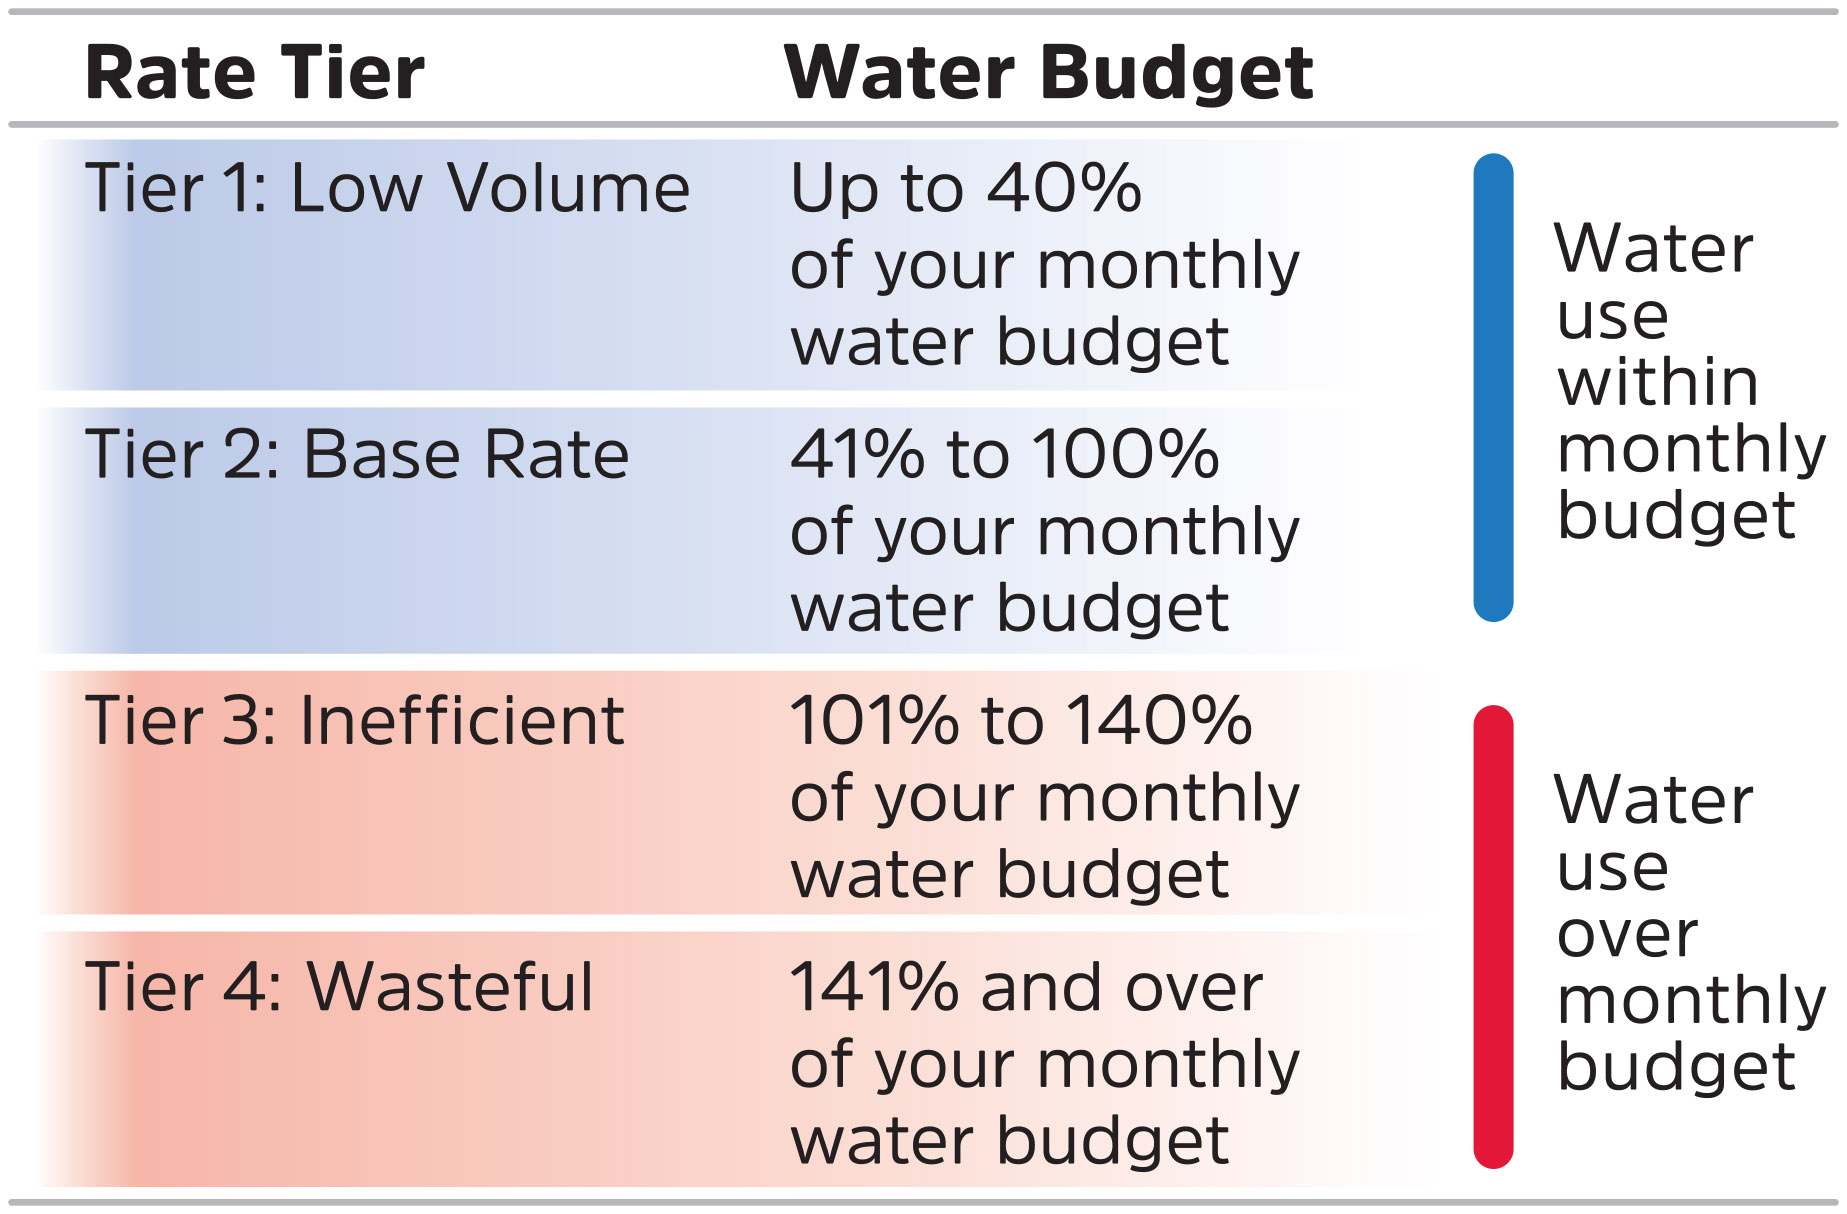
IRWD uses a budget-based water rate structure. How much you are charged for the water you use depends on whether you stay within your monthly budget. For residential customers, each residence is assigned a monthly water usage budget based on several factors, including the number of people who live in the home, the square footage of outdoor landscaped area, and the weather. The chart below explains how the rate tiers work for residential and landscape water customers.
Commercial customers are billed based on a similar structure, but with two tiers: Base Rate (0-100%) and Wasteful (101%+).
For specifics on the rate structure for each customer type, see the IRWD Proposition 218 Notices above.
Understanding basic components of your water bill
- Variable water usage charges: Variable costs — for water you use both indoors and outdoors each month. These charges are based on the cost of local and imported water, and other costs of providing service that vary based on usage.
- Service charges: Fixed costs — to recover the fixed expenses of operating and maintaining IRWD's infrastructure. There are separate service charges for water and sewer service. These monthly fixed costs fluctuate depending on the number of days in a billing cycle.
For customers at higher elevations, a pumping surcharge is added to the variable water usage charge to cover pumping costs.
Each tier is assigned a rate based on the actual cost of service, which varies according to the source of water. Each source has a different cost of water service. For example, local groundwater from the Dyer Road Well Field here in Orange County is IRWD's lowest-cost water, while imported water (from out of state or Northern California) is our highest-cost water.
The Low Volume rate tier rewards customers who use the least water, which reduces the need for IRWD to buy water supplies that are more expensive. The Base Rate tier is for customers who stay within their monthly water budget allocation. The Inefficient and Wasteful tiers are for customers who exceed their monthly budget.
Why did the cost of water service increase?
The main reasons for the change include uncontrollable cost increases to IRWD attributed to:
• Pass-through charges (5.7% increase) from Orange County Water District (OCWD) for pumping local groundwater, which is still the lowest-cost water.
• Pass-through charges from Metropolitan Water District of Southern California (MWD) for imported water purchased through the regional wholesaler, the Municipal Water District of Orange County (MWDOC) (4.6% increase).
• Pass-through charges from Southern California Edison (SCE) for electricity used in IRWD service operations (10% increase).
• Increases in costs associated with continuing to provide the current high level of water service our customers expect, including costs associated with repairs and maintenance related to maintaining the existing infrastructure (11.8% increase).
In recognition of financial challenges facing customers during the first 20 months of the COVID-19 pandemic, the IRWD Board of Directors suspended a previously approved rate increase that was to become effective on July 1, 2020, and deferred a rate increase for costs associated with the adoption of the new two-year budget in April 2021. IRWD is now increasing rates based on its current cost of providing water service.
Updates to budget-based rate structure and rates
The following sections provide key information on indoor and outdoor water budgets, billing tiers, fixed service charges, pumping surcharges and other technical data. For full details specific to your account type, please view your specific IRWD Proposition 218 Notice. A downloadable copy is available near the top of this page.
Click on the sections below for additional information:
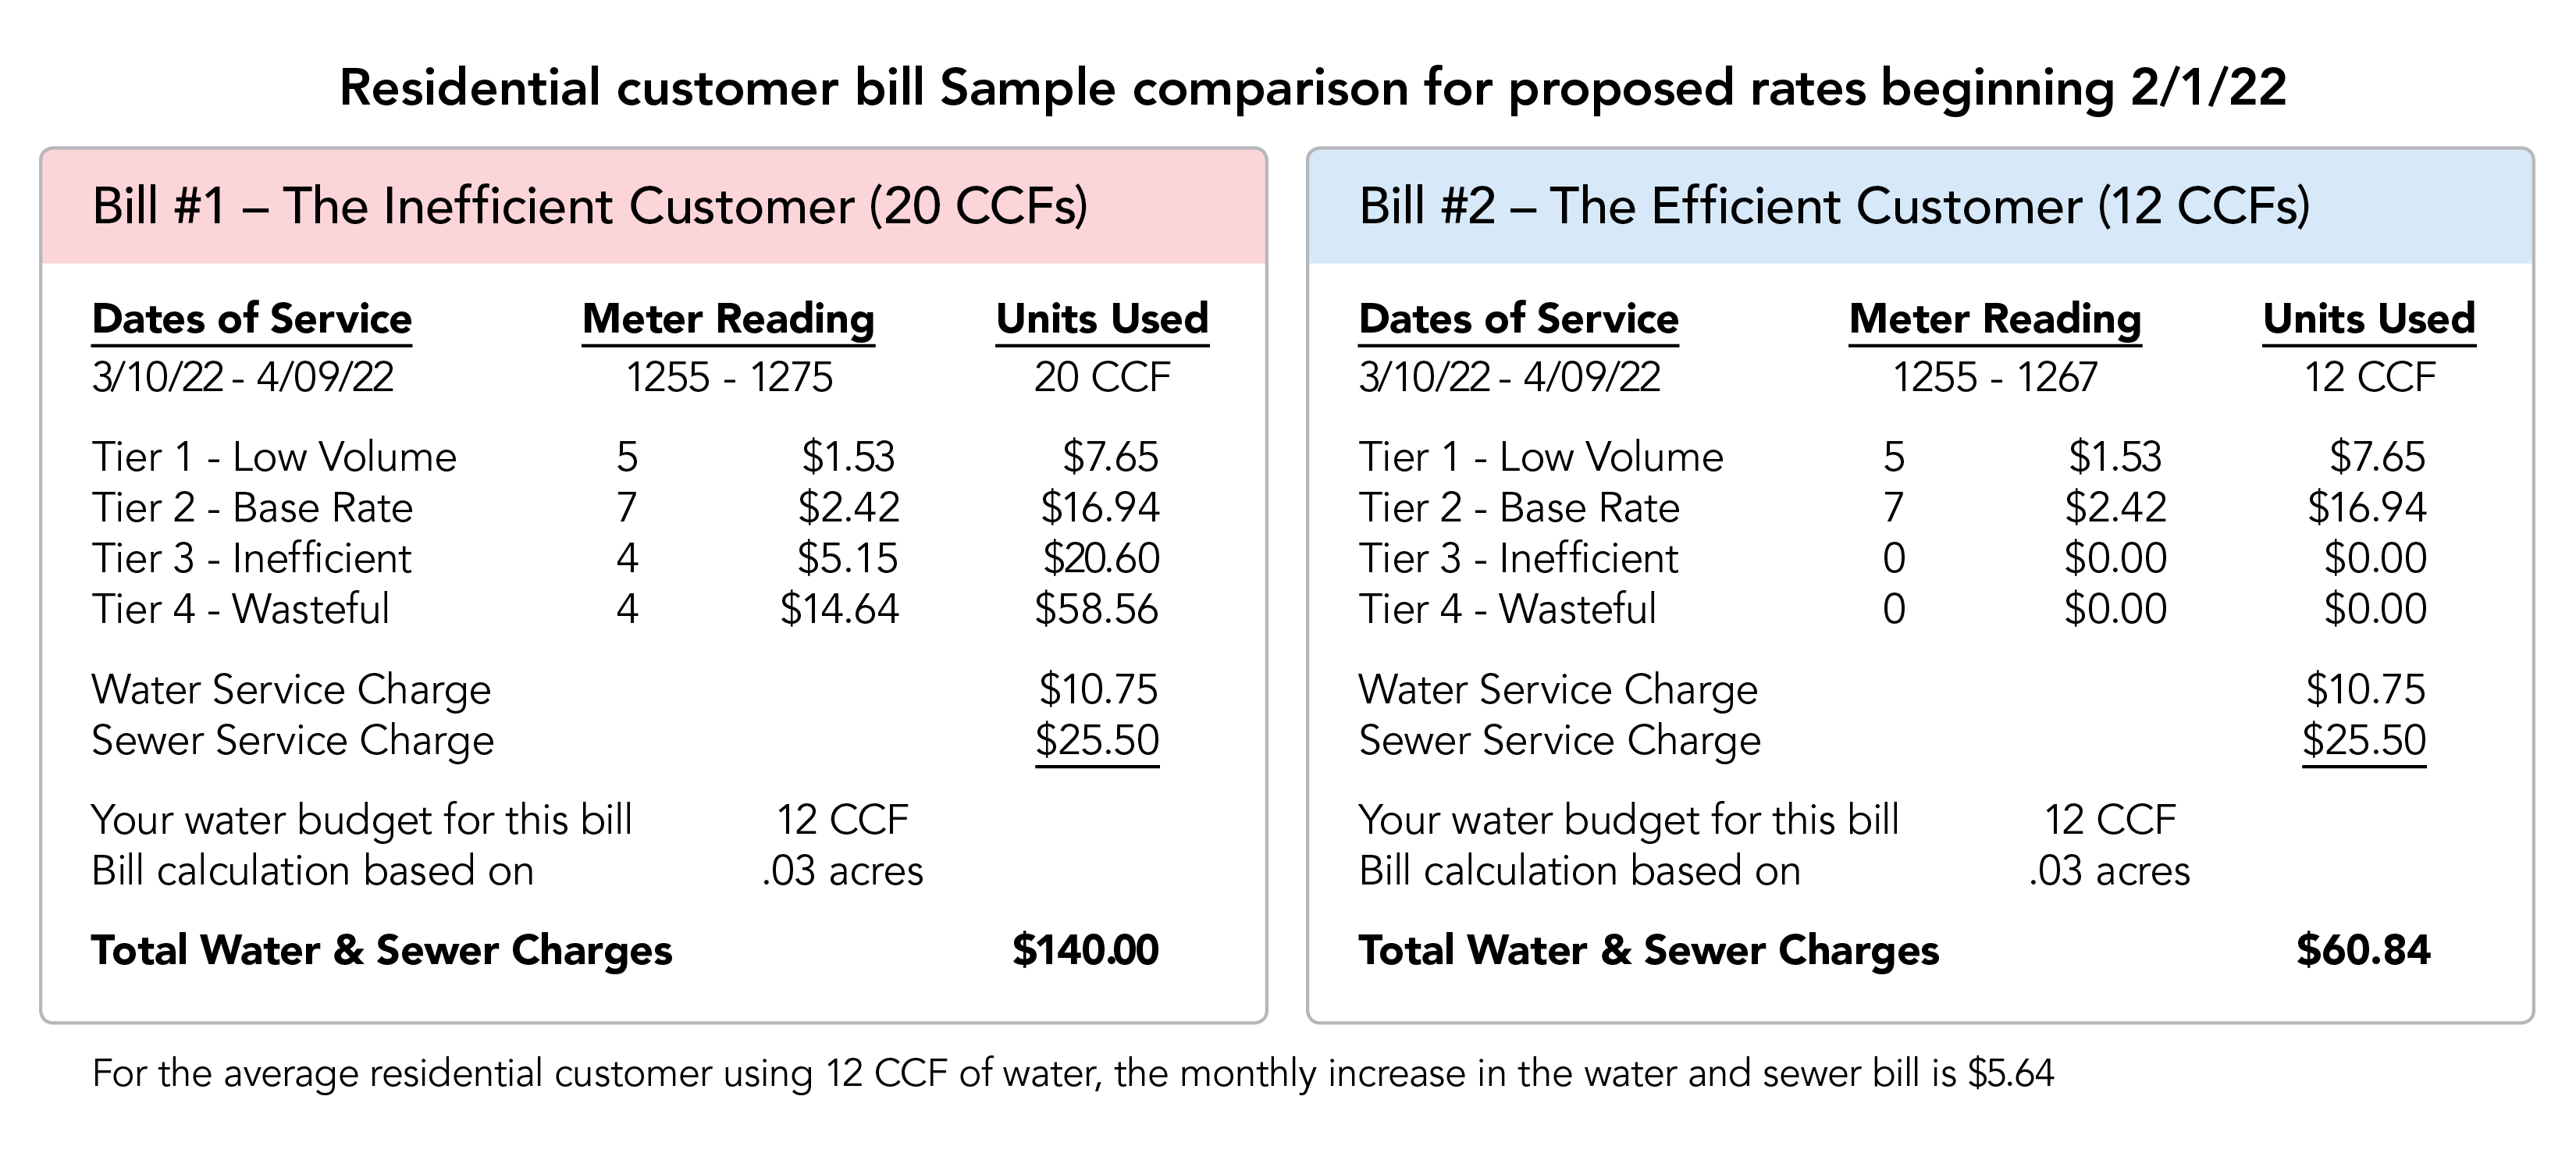
Note: Sample bills do not include any potential pumping surcharge amounts
|
Proposed potable water rates per CCF* for residential and landscape customers based on cost of service
|
|
Building tiered rates
|
Low volume
|
Base Rate
|
Inefficient
|
Wasteful
|
|
Lowest cost source of water
|
$1.53
|
|
|
|
|
Melded cost of water
|
|
$2.34
|
|
|
|
Loaded cost of imported water
|
|
|
$3.29
|
$3.29
|
|
District-wide conservation
|
|
$0.08
|
$0.08
|
$0.08
|
|
Water banking
|
|
|
|
$2.08
|
|
Targeted conservation
|
|
|
$1.16
|
$4.92
|
|
Natural Treatment System (NTS)
|
|
|
$0.62
|
$4.27
|
|
Total cost per tier
|
$1.53
|
$2.42
|
$5.15
|
$14.64
|
|
FY 2021 rates per tier
|
$1.47
|
$2.00
|
$4.86
|
$13.63
|
|
Change
|
$0.06
|
$0.42
|
$0.29
|
$1.01
|
*1 CCF=748 gallons
|
Proposed potable water rates per CCF for commercial customers based on cost of service
|
|
Building tiered rates
|
Base Rate
|
Wasteful
|
|
Melded cost of water
|
$2.34
|
|
|
Loaded cost of imported water
|
|
$3.29
|
|
District-wide conservation
|
$0.08
|
$0.08
|
|
Water banking
|
|
$2.08
|
|
Targeted conservation
|
|
$4.92
|
|
Natural Treatment System (NTS)
|
|
$4.27
|
|
Total cost per tier
|
$2.42
|
$14.64
|
|
FY 2021 rates per tier
|
$2.00
|
$13.63
|
|
Change
|
$0.42
|
$1.01
|
|
Proposed recycled water rates per CCF for residential and landscape customers based on cost of service
|
|
Building tiered rates
|
Low volume
|
Base Rate
|
Inefficient
|
Wasteful
|
|
Lowest cost source of water
|
$1.23
|
|
|
|
|
Melded cost of water
|
|
$2.08
|
|
|
|
Loaded cost of imported water
|
|
|
$3.31
|
$3.31
|
|
District-wide conservation
|
|
$0.08
|
$0.08
|
$0.08
|
|
Targeted conservation
|
|
|
|
$0.65
|
|
Natural Treatment System (NTS)
|
|
|
$0.64
|
$3.16
|
|
Total cost per tier
|
$1.23
|
$2.16
|
$4.03
|
$7.20
|
|
FY 2021 rates per tier
|
$1.19
|
$1.57
|
$3.15
|
$6.62
|
|
Change
|
$0.04
|
$0.59
|
$0.88
|
$0.58
|
|
Proposed recycled water rates per CCF for commercial customers based on cost of service
|
|
Building tiered rates
|
Base Rate
|
Wasteful
|
|
Lowest cost source of water
|
$1.23
|
|
|
Loaded cost of imported water
|
|
$3.31
|
|
District-wide conservation
|
|
$0.08
|
|
Targeted conservation
|
|
$0.65
|
|
Natural Treatment System (NTS)
|
|
$3.16
|
|
Total cost per tier
|
$1.23
|
$7.20
|
|
FY 2021 rates per tier
|
$1.19
|
$6.62
|
|
Change
|
$0.04
|
$0.59
|
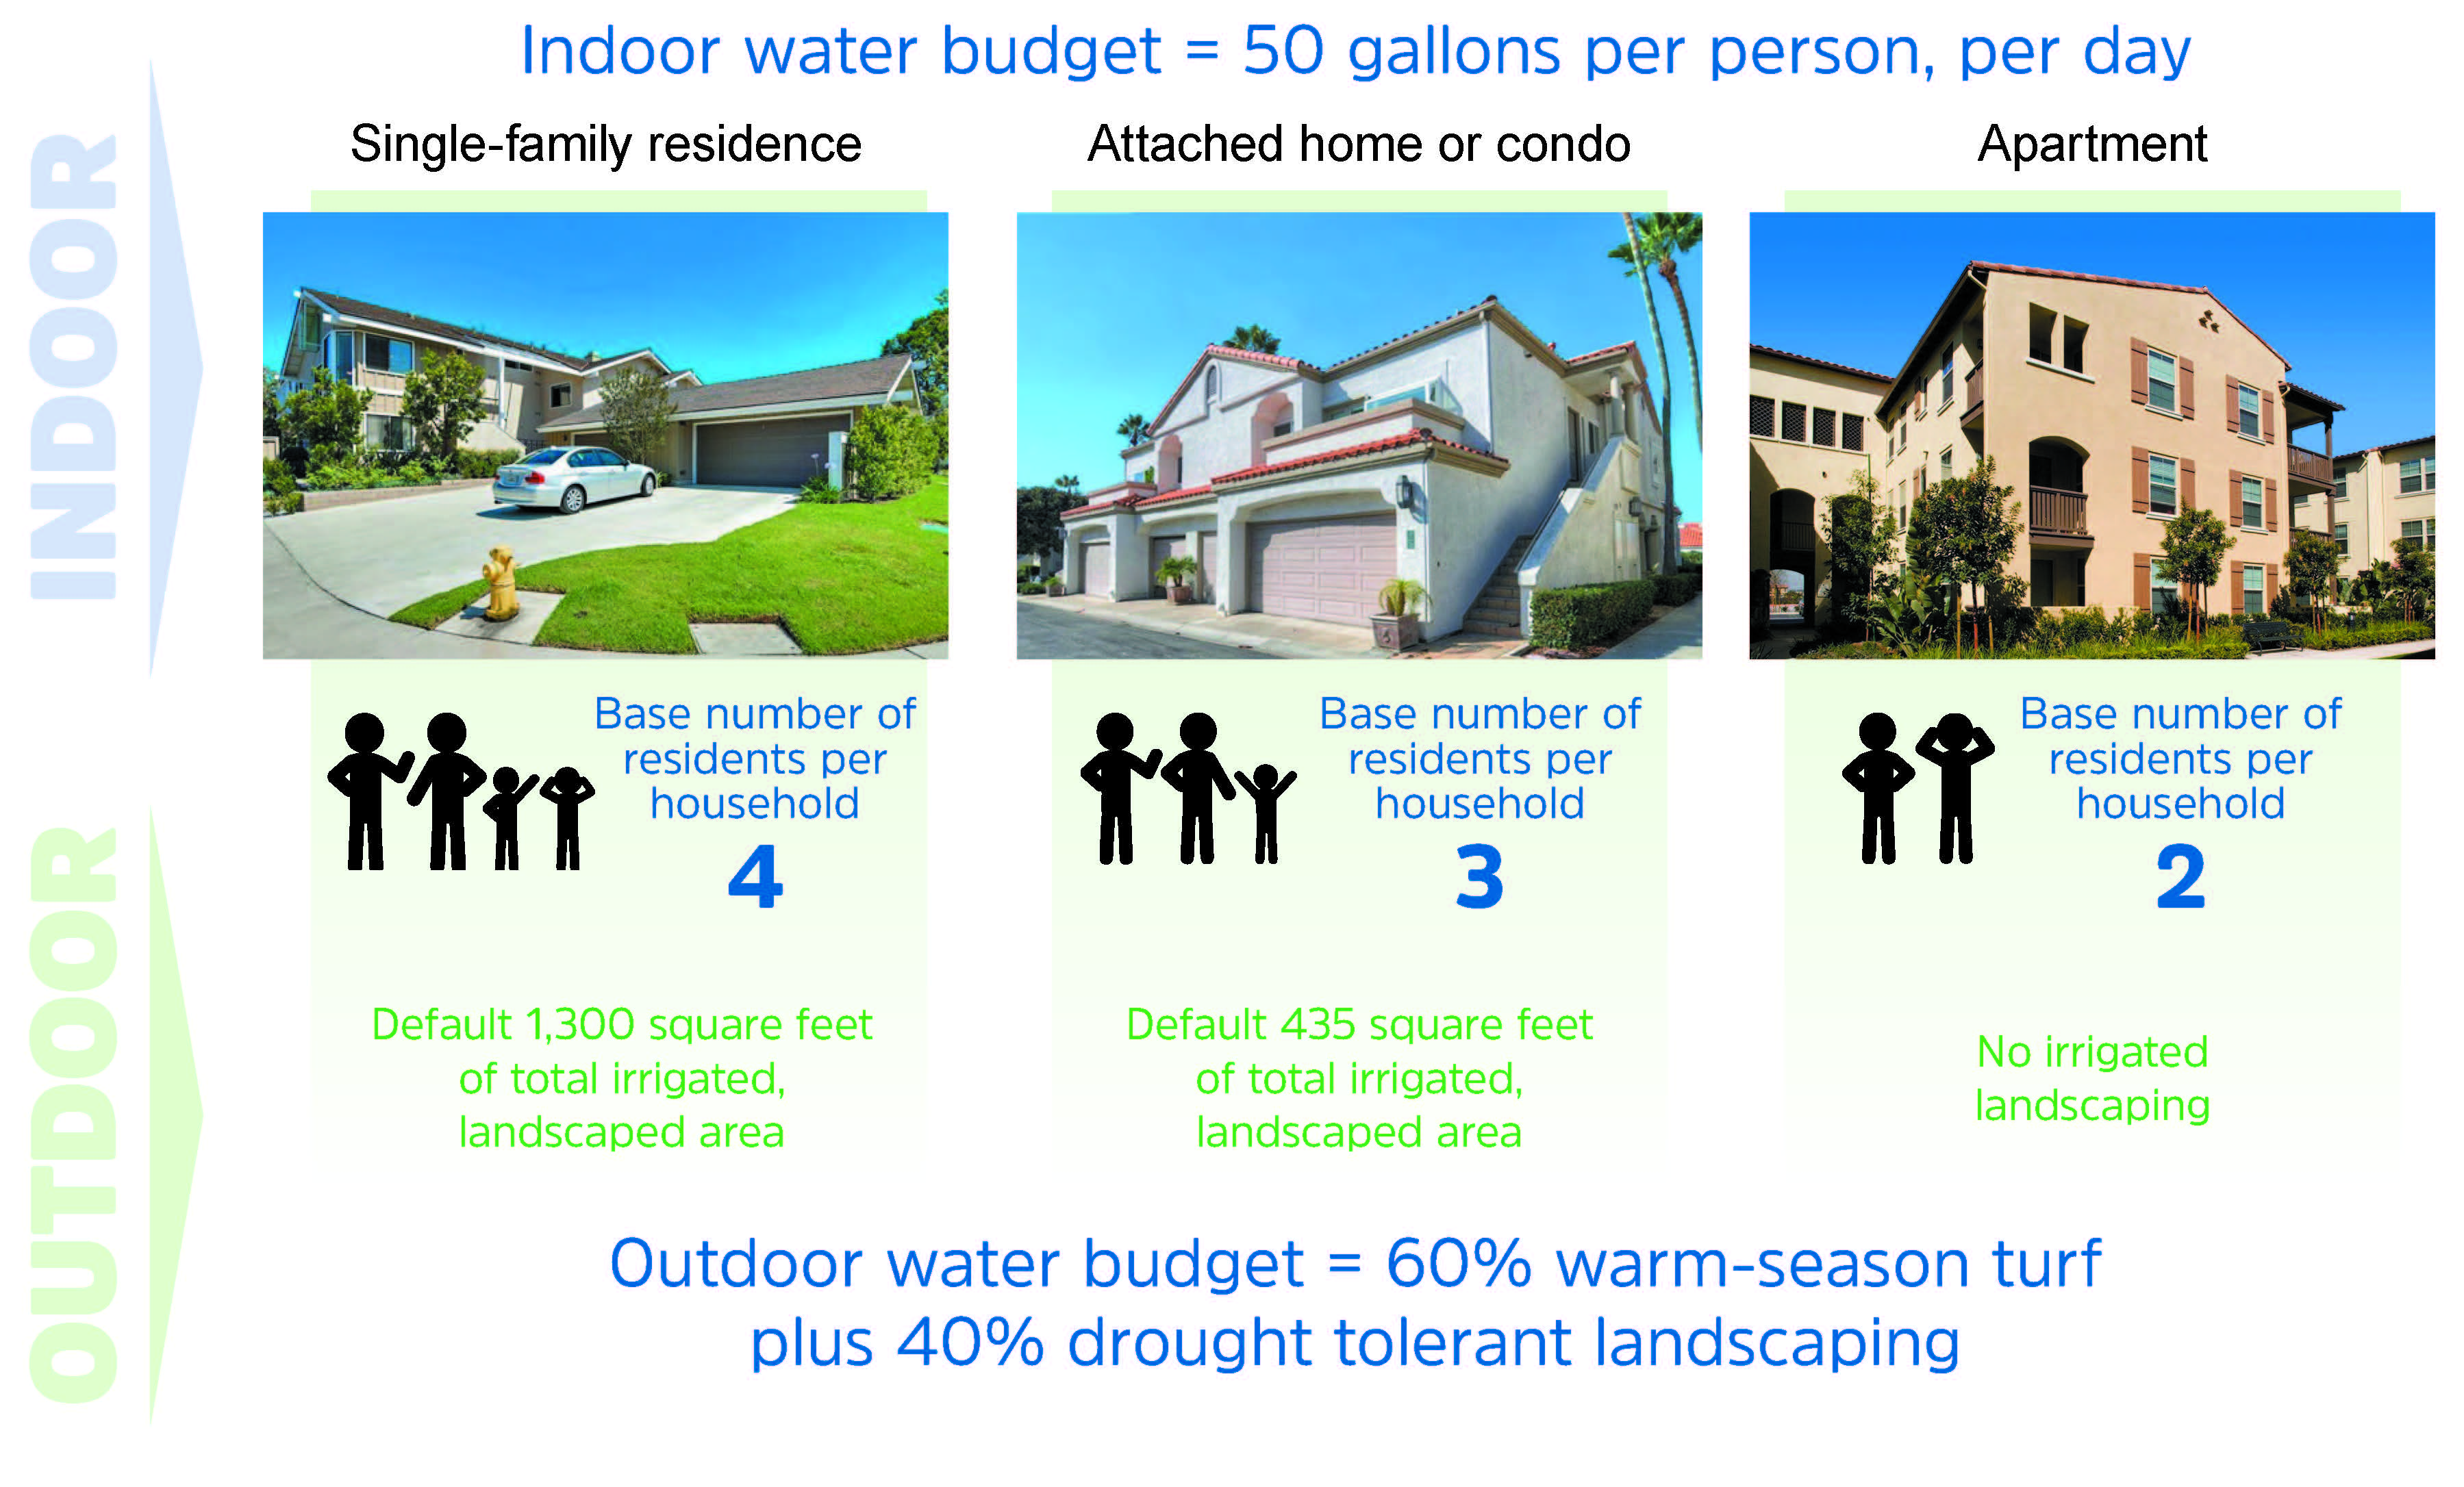
The indoor water budget for all customers remains unchanged at 50 gallons per resident per day. Your potable outdoor monthly water budget is based on 60% warm-season turf and 40% drought-tolerant landscaping. Your potable outdoor water budget is not based on 100% drought-tolerant landscaping. Those customers with lawns may go over their monthly water budget.
Default formula for residential customers:

Your outdoor monthly water budget is based on 60% warm-season turf and 40% drought-tolerant landscaping.
Customers with cool-season turf lawns may be over their monthly outdoor water budget.
Customers who continue to irrigate nonturf landscape with sprinklers and overhead spray may go over their monthly budget because these systems are less efficient at delivering water to the plants.
Drip irrigation is the most efficient form of irrigation for nonturf areas.
|
Outdoor landscape potable and recycled water monthly budget
|
|
Type
|
Monthly budget basis
|
|
Irrigated with potable water
|
60% warm-season turf + 40% drought-tolerant landscape
|
|
Irrigated with recycled water
|
100% warm-season turf
|
|
Average monthly residential water budget for a 30-day billing period
|
|
Residence type
|
Indoor CCF
|
Average outdoor CCF
|
Total average monthly budget CCF
|
|
Attached home condo
|
6
|
1
|
7
|
|
Apartment
|
4
|
N/A
|
4
|
|
Single family residence
|
8
|
4
|
12
|
The monthly fixed water service charges for the average residential customer will increase from $10.35 to $10.75.
The fixed water service charge is used to pay for operations and maintenance costs, including inevitable infrastructure enhancements and replacements.
The fixed water service charge is based on the meter size which appears on the bill. For a list of proposed changes to the water service charge for all meter sizes, please refer to the IRWD Proposition 218 Notice near the top of this page.
The fixed water service charge is based on a 30-day billing cycle. Billing cycles that are longer or shorter than 30 days will produce service charges that are proportionally larger or smaller. See below for examples for a typical customer with a FY 2019-20 $10.35 monthly fixed water service charge:
- 30-day billing cycle produces $10.75 water service charge
- 34-day billing cycle produces $12.18 water service charge
- 26-day billing cycle produces $9.32 water service charge
A water conservation, or “leaseback” credit recognizes low-volume users that don’t fully use their reserved flow capacity. IRWD will provide the credit to users who are underutilizing that flow and effectively “leasing back” to the system for other users. The leaseback credit is only available for potable, recycled and landscape customers. This prevents the District from having to upsize infrastructure as quickly as capacity is exhausted.
Note: The leaseback credit is noted as "Water Conservation Credit” on the monthly bill.
Customers that remain in the Tier 1 – “Low Volume” tier for 9 out of 12 months for the previous calendar year will receive a $2.00 monthly credit during the following year.
This credit is also based on a 30-day billing period and will be adjusted up or down depending on the actual length of the billing cycle. See below for examples:
- 30-day billing cycle produces $2.00 credit
- 34-day billing cycle produces $2.27 credit
- 26-day billing cycle produces $1.73 credit
- Note: New customers must be with the District for a full calendar year before they can receive the credit.
The proposed fixed monthly sewer service charges for the average residential customer are used to pay for operations and maintenance costs including inevitable infrastructure enhancements and replacements. There are tiered sewer service fixed charges based on the three months with the lowest potable water usage from the previous calendar year. For specific sewer service charges please see your IRWD Proposition 218 Notice above.
|
Proposed changes to sewer service fixed monthly charges for system operation and maintenance
|
|
Usage
|
Current monthly rates
|
Proposed rates beginning February 1, 2022
|
|
Average water usage exceeds 10 CCFs per month
|
$26.10
|
$29.75
|
|
Average water usage falls between 5 and 10 CCFs
|
$23.50
|
$25.50
|
|
Average water usage falls below 5 CCFs
|
$19.55
|
$20.45
|
|
Proposed changes for areas receiving collection service or treatment service only
|
|
Usage
|
Current monthly rates
|
Proposed rates beginning February 1, 2022
|
|
Collection service charge
|
$8.50
|
$9.25
|
|
Treatment service charge
|
$15.00
|
$16.25
|
Note: Until IRWD has a new customer's full calendar year of usage history, the customer is billed at the middle tier rate.
The sewer service charge is a fixed charge based on a 30-day billing cycle. Billing cycles that are longer or shorter than 30 days will produce service charges that are proportionally larger or smaller. See below for examples of an average customer with a $20.45 monthly fixed sewer service charge:
- 30-day billing cycle produces $20.45 sewer service charge
- 34-day billing cycle produces $23.18 sewer service charge
- 26-day billing cycle produces $17.72 sewer service charge
IRWD incurs additional pumping costs in order to provide service to customers at higher elevations.
The pumping surcharge is based on actual prevailing energy costs and varies depending upon the elevation of the area served. If a customer is in an area affected by a pumping surcharge, it will be itemized on the monthly bill.
PDF maps of the potable and recycled water pumping zones are available below.
|
Proposed pumping zones
|
Current surcharge
|
Proposed surcharge
|
|
Potable
|
|
|
|
Zone 1
|
$ 0.25
|
$0.33
|
|
Zone 2
|
$ 0.38
|
$0.46
|
|
Zone 3
|
$ 0.68
|
$ 0.79
|
|
Recycled
|
|
|
|
Zone A
|
$ 0.13
|
$0.14
|
|
Zone B
|
$ 0.23
|
$0.25
|
|
Zone C
|
$ 0.43
|
$0.47
|
*1 CCF = 748 gallons
Billing tiers are based on cost of service and on proportional use.
The number of billing tiers for residential and landscape customers remains unchanged at four, as follows:
- Tier 1 – Low Volume
- Tier 2 – Base Rate
- Tier 3 – Inefficient
- Tier 4 – Wasteful
The number of billing tiers for commercial customers also remains unchanged at two, as follows:
- Tier 1 - Base Rate
- Tier 2 - Wasteful
The billing tiers are based on cost of service and on proportional use.
|
Proposed billing tier percentages for residential and landscape customers — potable
|
|
Tier
|
% of monthly water budget
|
Proposed rates per CCF
(1 CCF = 748 gallons)
|
|
Tier 1 Low Volume
|
0 – 40%
|
$1.53
|
|
Tier 2 Base Rate
|
41 – 100%
|
$2.42
|
|
Tier 3 Inefficient
|
101 – 140%
|
$5.15
|
|
Tier 4 Wasteful
|
141+
|
$14.64
|
|
Proposed billing tier percentages for landscape customers — recycled
|
|
Tier
|
% of monthly water budget
|
Proposed rates per CCF
(1 CCF = 748 gallons)
|
|
Tier 1 Low Volume
|
0 – 40%
|
$1.23
|
|
Tier 2 Base Rate
|
41 – 100%
|
$2.16
|
|
Tier 3 Inefficient
|
101 – 140%
|
$4.03
|
|
Tier 4 Wasteful
|
141+
|
$7.20
|
|
Proposed billing tier percentages for commercial customers — potable
|
|
Tier
|
% of monthly water budget
|
Proposed rates per CCF
(1 CCF = 748 gallons)
|
|
Base Rate
|
0 – 100%
|
$2.42
|
|
Wasteful
|
101%+
|
$14.64
|
|
Proposed billing tier percentages for commercial customers — recycled
|
|
Tier
|
% of monthly water budget
|
Proposed rates per CCF
(1 CCF = 748 gallons)
|
|
Base Rate
|
0 – 100%
|
$1.23
|
|
Wasteful
|
101%+
|
$7.20
|
The water budget for landscapes irrigated with potable (drinking) water is based on an 80% irrigation efficiency. This results in an evapotranspiration factor (ET factor) of 0.75. The water budget for recycled water use and for functional turf irrigated with drinking water, such as a sport field is based on 75% irrigation efficiency. This results in a landscape factor of 0.87.
| Technical formula for the monthly water budget |
| Account type |
Number of residents
(default) |
Landscape area (default) |
Indoor budget
50 gallons per personper day |
Outdoor
water budget*LA x ET x ETF |
Total monthly
water budget |
| Attached home condo |
3 |
435 sq. feet |
# Residents x 50 gpd x days in bill period |
LA x ET x ETF (0.75) |
Indoor + outdoor |
| Apartment |
2 |
N/A |
# Residents x 50 gpd x days in bill period |
N/A |
Indoor |
| Single family residence |
4 |
1,300 sq. feet |
# Residents x 50 gpd x days in bill period |
LA x ET x ETF (0.75) |
Indoor + outdoor |
| Irrigation potable |
N/A |
Site specific based on irrigated acreage |
N/A |
LA x ET x ETF (0.75) |
Outdoor |
| Irrigation recycled |
N/A |
Site specific based on irrigated acreage |
N/A |
LA x ET x ETF (0.87) |
Outdoor |
| Functional turf irrigated with potable water |
N/A |
Site specific based on irrigated acreage |
N/A |
LA x ET x ETF (0.87) |
Outdoor |
| Commercial, industrial institutional |
N/A |
Site specific based on irrigated acreage |
Site specific |
Site specific, based on irrigation needs |
Site Specific |
| *the outdoor water budget is multiplied by 36.3 to convert to ccf |
Definitions:
| gpd |
Gallons per day |
| ccf |
100 cubic feet. 1 ccf = 1 billing unit or 748 gallons |
| LA |
Irrigated landscape acreage of the specific property (acres) |
| ET - evapotranspiration |
Reference evapotranspiration: The amount of water that evaporates into the air and the amount of water that is transpired through the vegetation. Evapotranspiration values are computed daily from IRWD’s three weather stations for the bill period. This data is provided from IRWD weather stations located in the coastal, central or foothill zones. |
ET factor (ETF)
|
The ET factor measures the specific amount of irrigation water needed for the plants in your yard and also accounts for the efficiency of your irrigation system. The rate structure is based on the assumption that your landscaped area is 60% grass and 40% drought tolerant plants, and the irrigation system is 80% efficient. This combines for a potable ET factor of 0.75. For recycled water and functional turf irrigated with potable water, the ET factor is 0.87, based on 100% warm season turf and an irrigation system efficiency of 75%. |
| Indoor Use |
Based on the number of people per household for residential accounts. Based on the number of employees and business process water for commercial/industrial accounts |
| N/A |
Not applicable |
The chart below summarizes the assumptions made by IRWD for residential water budgets, depending on the type of residence. IRWD encourages residential customers who need more water than their basic water budget provides to apply for a variance. Variances are given for additional occupants, special medical needs, and larger landscaped areas, among other things. Variances are effective the date that the request is received by the District and must be renewed annually. You can apply online or download a variance form here.

IRWD adopted a Water Shortage Contingency Plan (WSCP) in 2021 as part of its Urban Water Management Plan. The WSCP includes requirements to implement locally appropriate water shortage response actions for six standard water shortage levels. Implementation of WSCP rates would require action by the IRWD Board of Directors and separate customer outreach. Currently, IRWD is not projecting any water shortages. For details on the rates proposed as potential response actions please click here.
To use the WSCP budget-based-rate calculator, visit wscprates.IRWD.com.
Save
Save


